
The Market Takes a Breath
Please be aware: More recent data has been published since the time of this post. To see current market trends, check out the most recent issues of Market Updates.
Middle-market deal flow paused in Q1 2016 as buyers and lenders took harder looks at potential deals. While corporate balance sheets hold approximately $1.5 trillion in cash, according to Federal Reserve data, and private equity funds collectively hold dry powder of $534 billion, per Pitchbook, strategic and PE buyers have refocused on quality companies given rising valuations combined with uncertainty in the U.S. macro environment. GF Data's latest report indicates private equity transaction volumes involving deals between $10 million and $250 million fell by 36.4% and 35.4% on a quarter-over-quarter and year-over-year basis, respectively. However, there is cause for optimism as companies in the middle market experienced year-over-year revenue growth leading to increased confidence, according to the National Institute for the Middle Market.
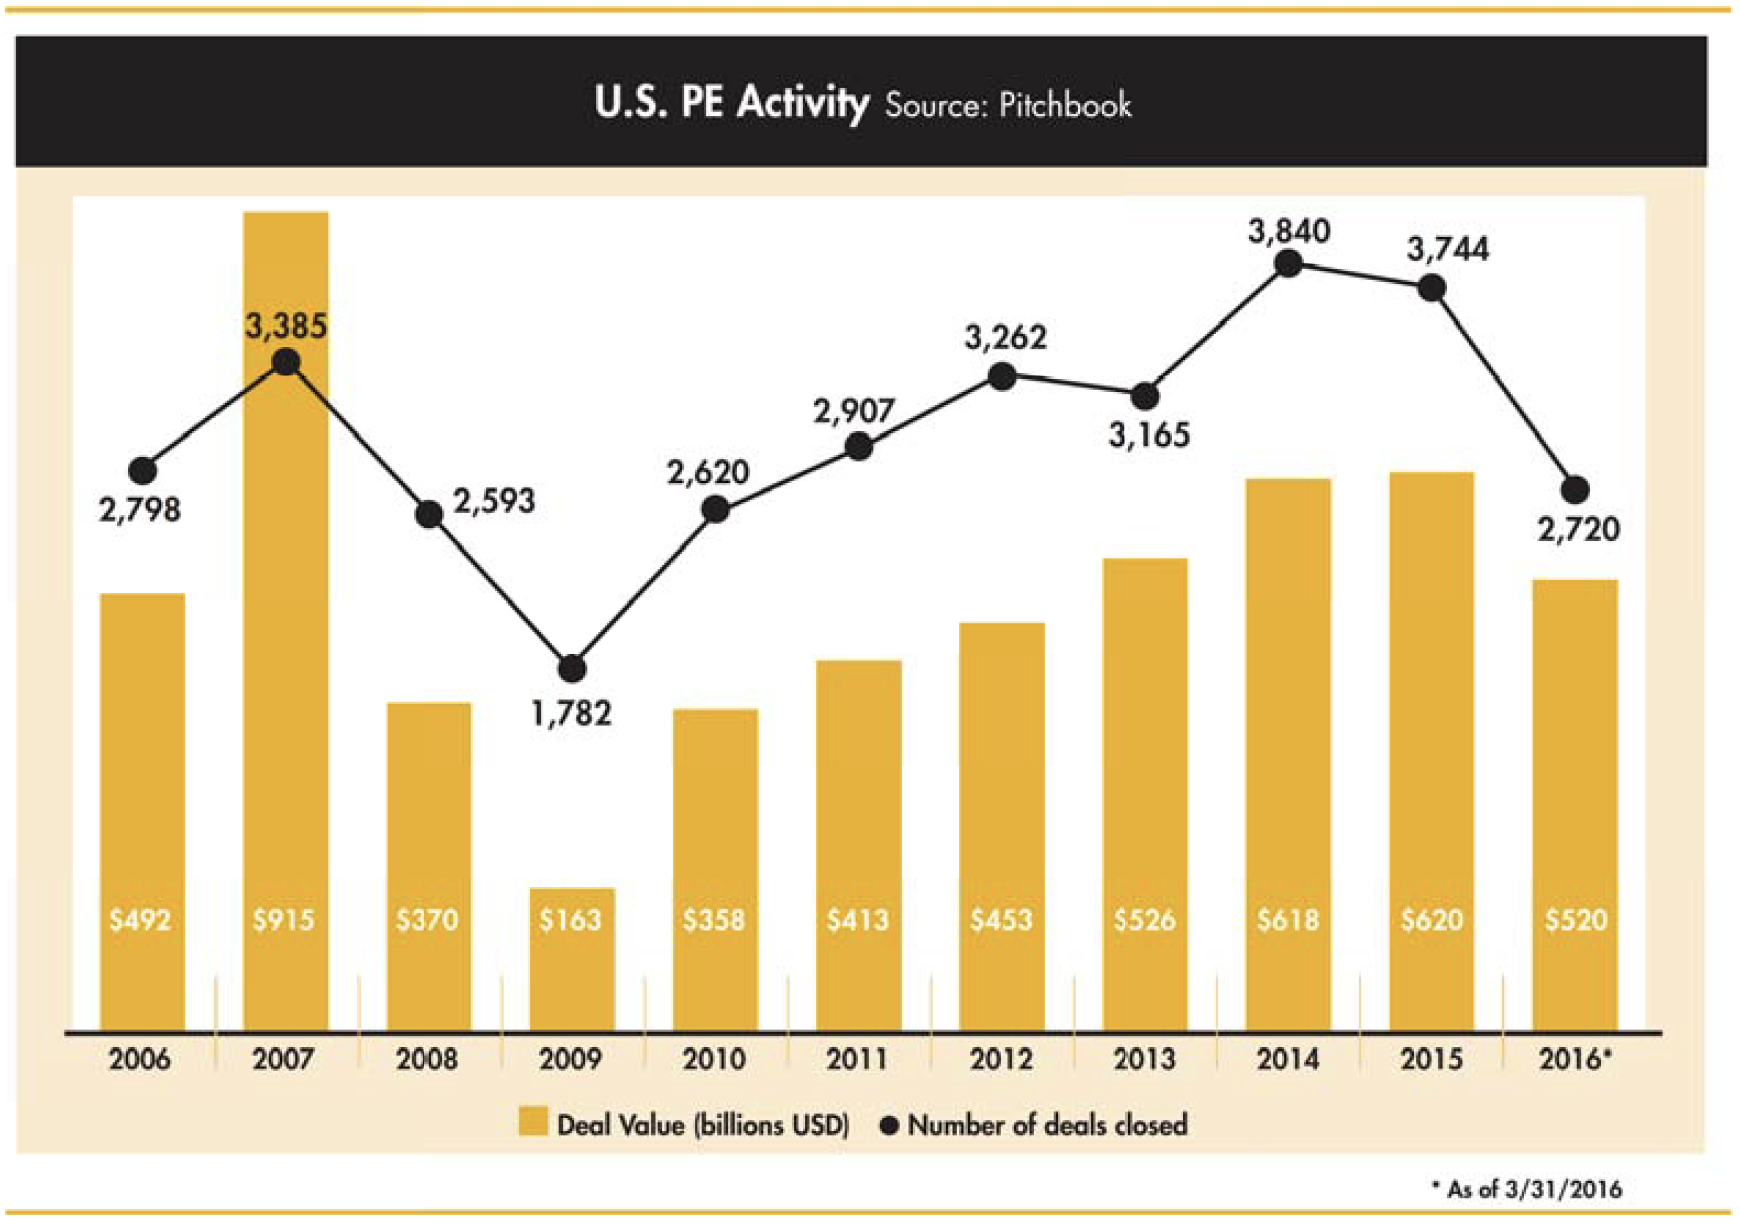
Coming off of two of the best years in the last decade in terms of deal activity, Q1 2016 deal activity cooled according to Pitchbook's analysis of private equity deal flow. Annualizing 2016 based on first quarter data, it appears there may be declines in volume and capital invested in 2016 as compared to 2015.
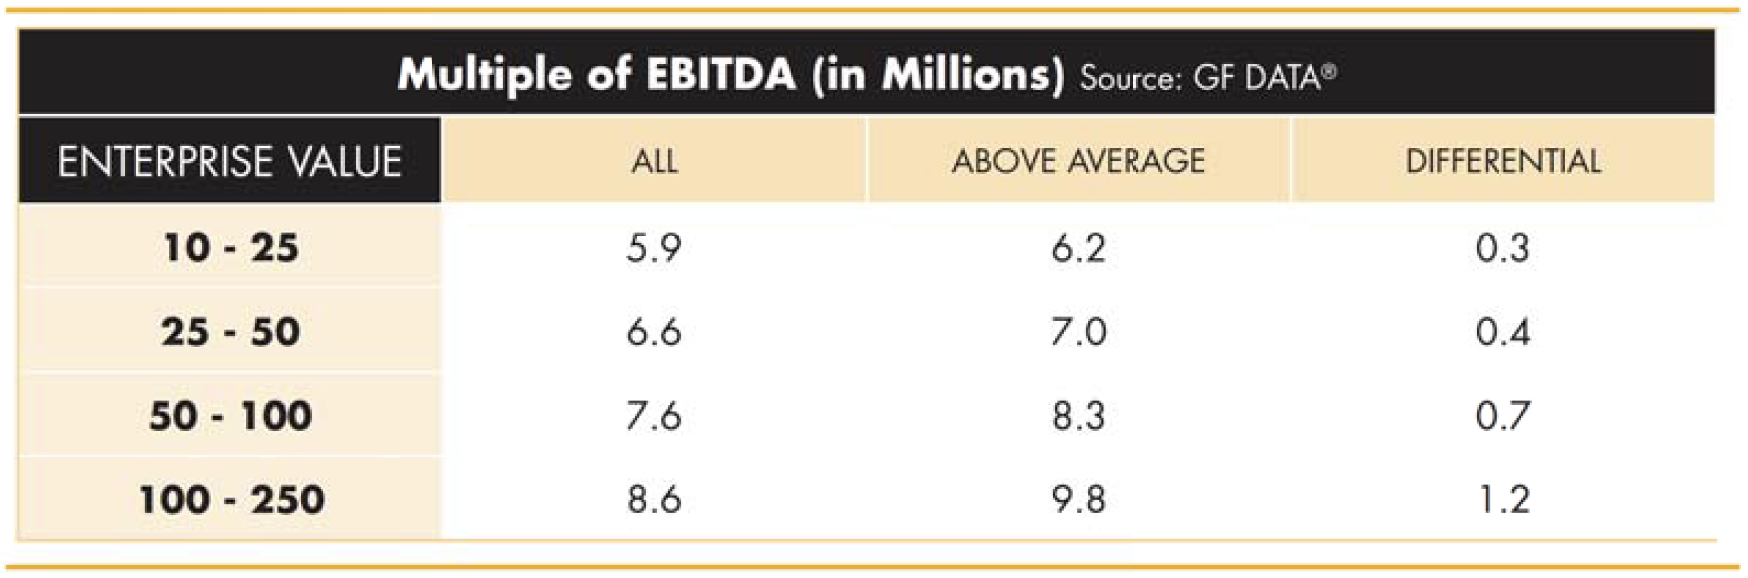
While deal activity overall might hove softened during Q1 2016, buyers are still placing a premium on quality companies. According to GF Data, companies with above-average financials command an extra 0.3x-1.2x EBITDA. GF Data defined above overage as companies with EBITDA margin and revenue growth rates above 10% or one of the metrics above 12% and the other at least 8%.
Platform Versus Add-on Valuations
Add-on/roll-up acquisitions continue to command a premium over platform-based acquisitions as the ability to more easily finance smaller add-on/roll-up acquisitions allows firms the flexibility to pay up for a desired target. According to GF Data's analysis of 2015 and first quarter 2016, transactions of $10 million to $50 million registered one-half turn higher valuations for add-ons and roll-ups. As the enterprise values of the targets increased, so did the spread between platforms and add-ons/ roll-ups. When combined with the platform investment, add-ons or roll-ups provide revenue diversification, synergistic value, and multiple arbitrage opportunities.

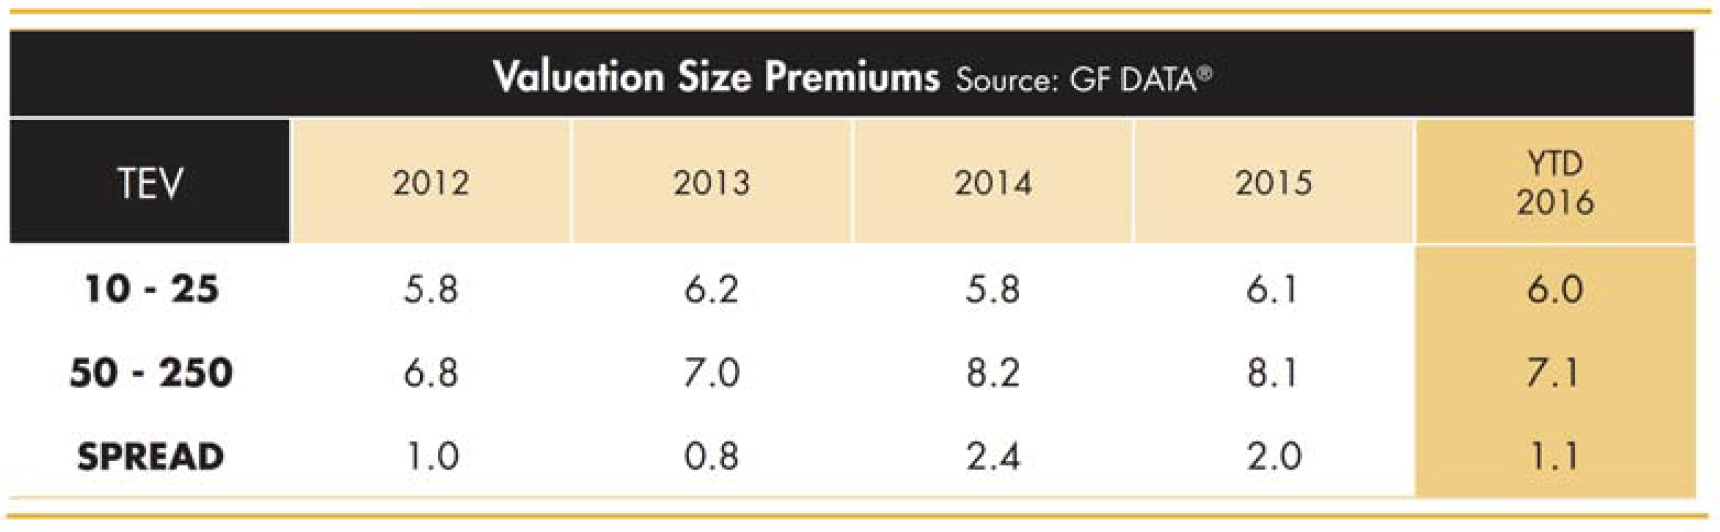
In addition, the valuation spread between larger ($50 million to $250 million) and smaller transactions ($10 million to $50 million) declined between 2015 and Q1 2016 from 2.0x to 1.1x trailing EBITDA and is well below the spread seen during 2014. However, it will be important to watch size premiums throughout the rest of 2016 to ascertain whether Q1 2016 was an anomaly or rather the start of a trend.
Credit Conditions
The pause in transaction activity seen in Q1 2016 is caused in part by lenders looking more closely at deals. "PE deal activity lives and dies with lender appetite, and the uncertainty in the market- reflected in the volatility witnessed in the equity markets-has led many midmarket lenders to tap the brakes," according to Pitch book's U.S. PE Breakdown Q1 2016. According to Thomson Reuters' Leveraged Loan Monthly, new origination of middle- market leverage loans for deals below $100 million fell sharply in Q1 2016 ($5.2 billion), down 13% from Q4 2015 ($6.0 billion) and 44% from Q1 2015 ($9.3 billion). Leverage loan originations during Q4 2015 and Q1 2016 were at their lowest levels since Q3 2013.
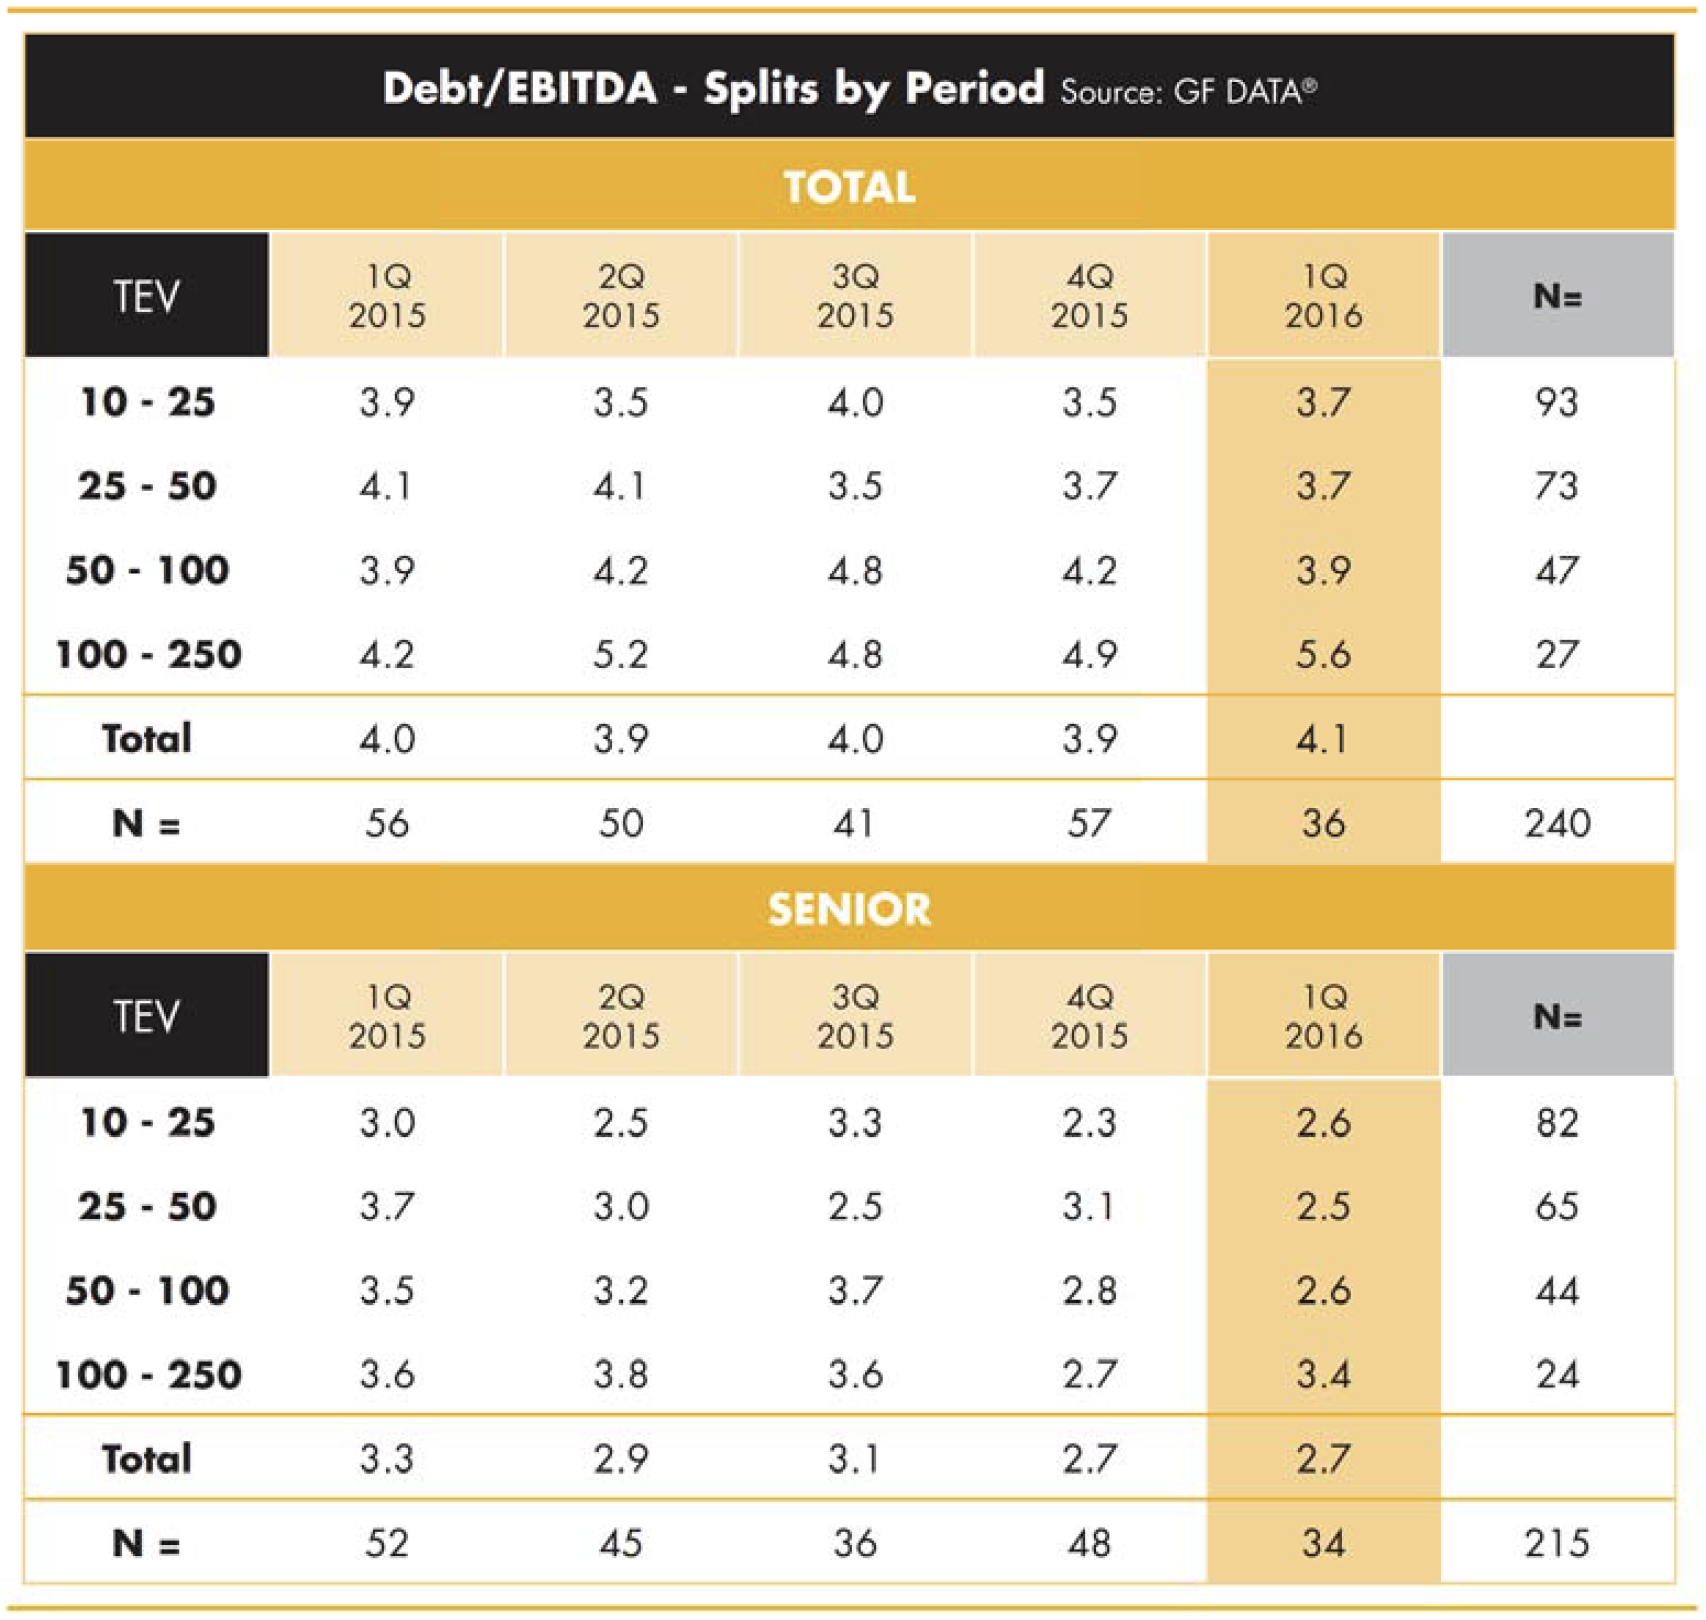
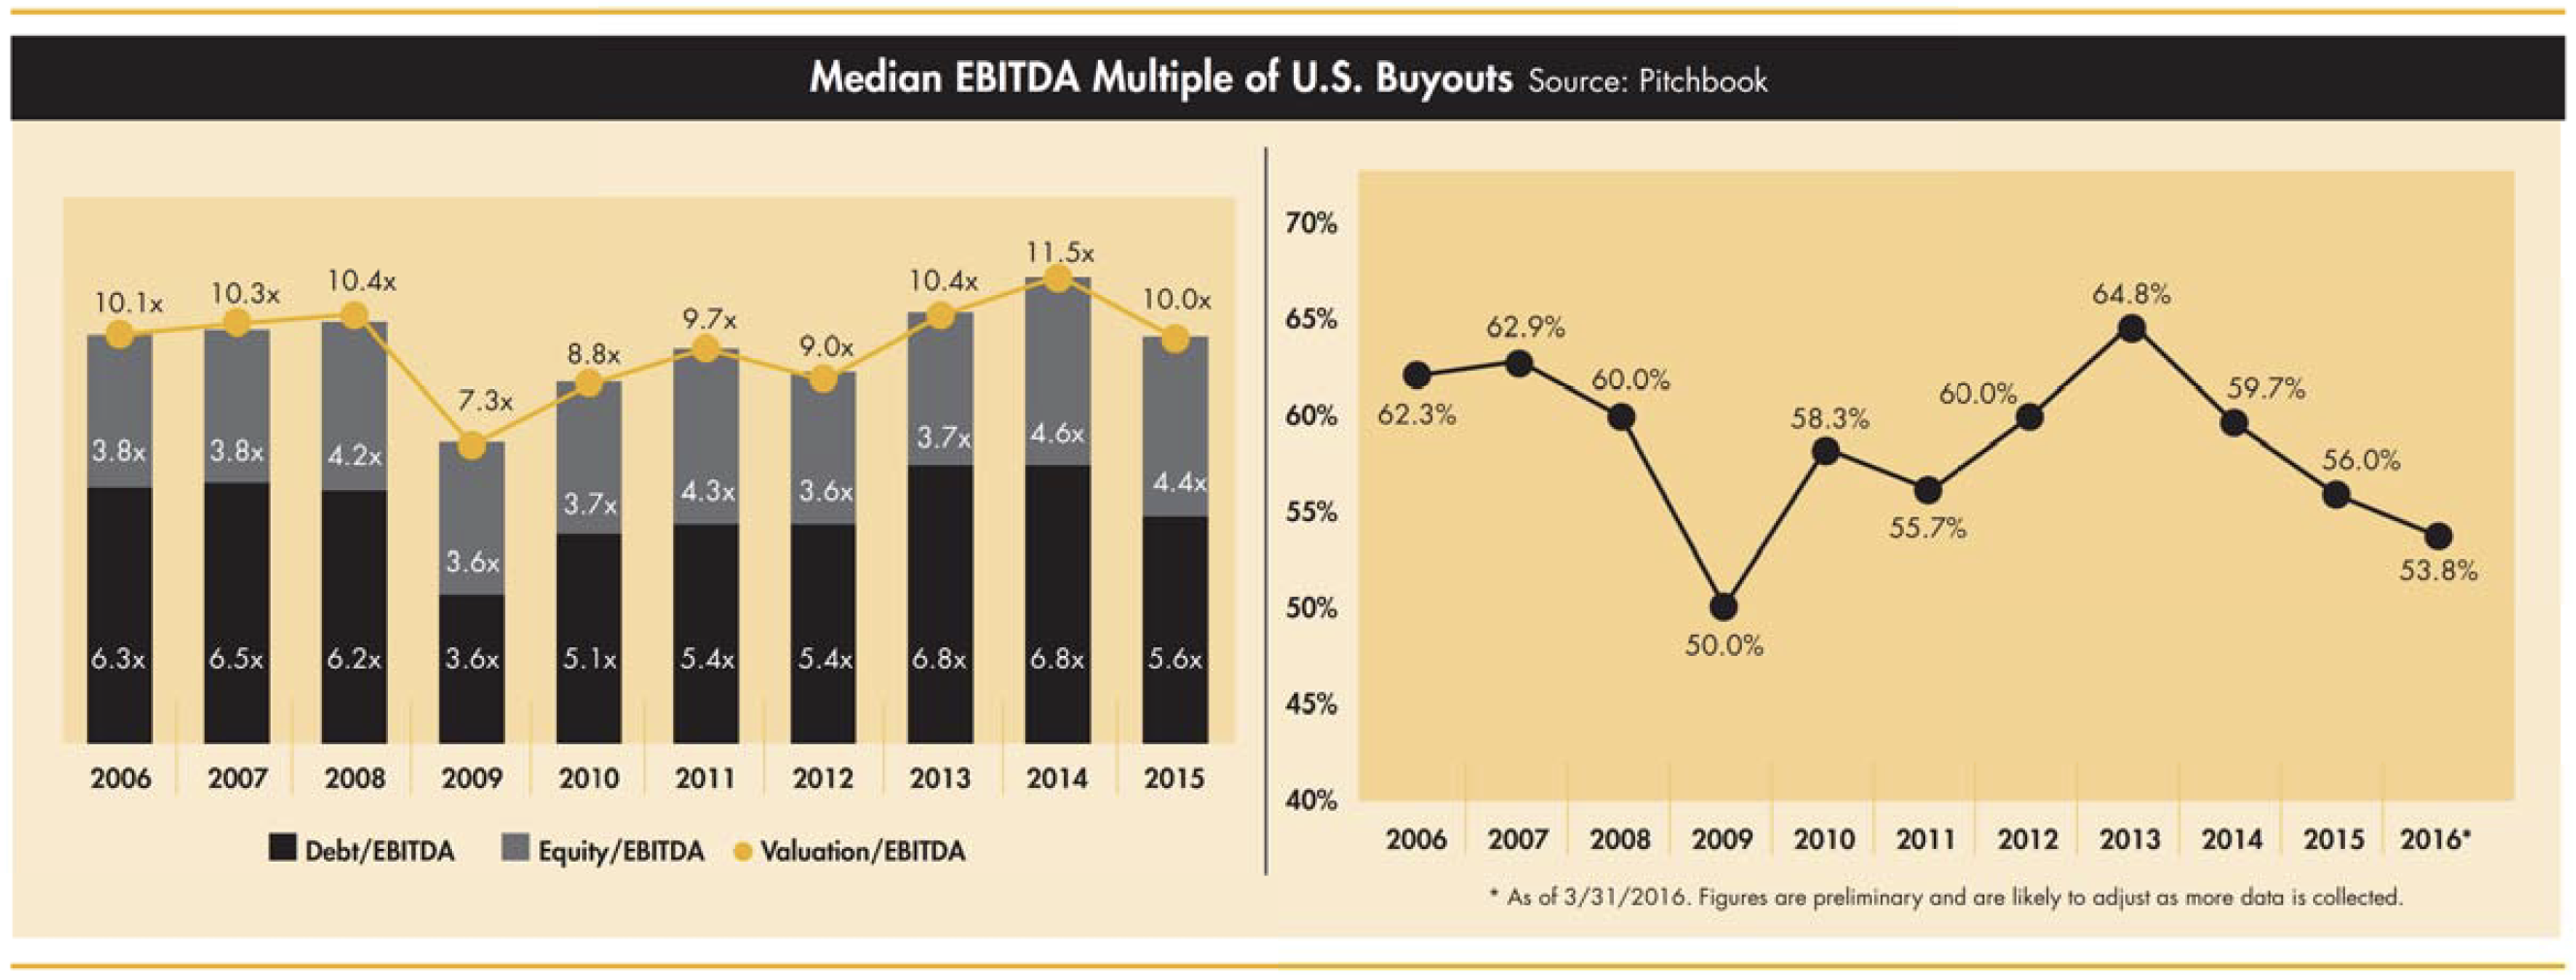
Still, there are other indications of stability throughout the credit markets. GF Data shows debt multiples increased slightly between Q4 2015 and Q1 2016, with average total debt to EBITDA ratios increasing from 3.9x to 4.1x. For deal values between $10 million and $25 million, total debt to EBITDA has declined between Q1 2015 and Q1 2016 from 3.9x to 3.7x.
Credit Imapct on Valuations
Average equity contributions for middle- market transactions rose from 44.0% during 2015 to 46.2% in Q1 2016, according to Pitchbook. Increased equity requirements to complete buyouts reduce returns for private equity funds without a change in valuations. Leverage, measured by debt to EBITDA, declined by 1 .2x from 2014 to 2015.
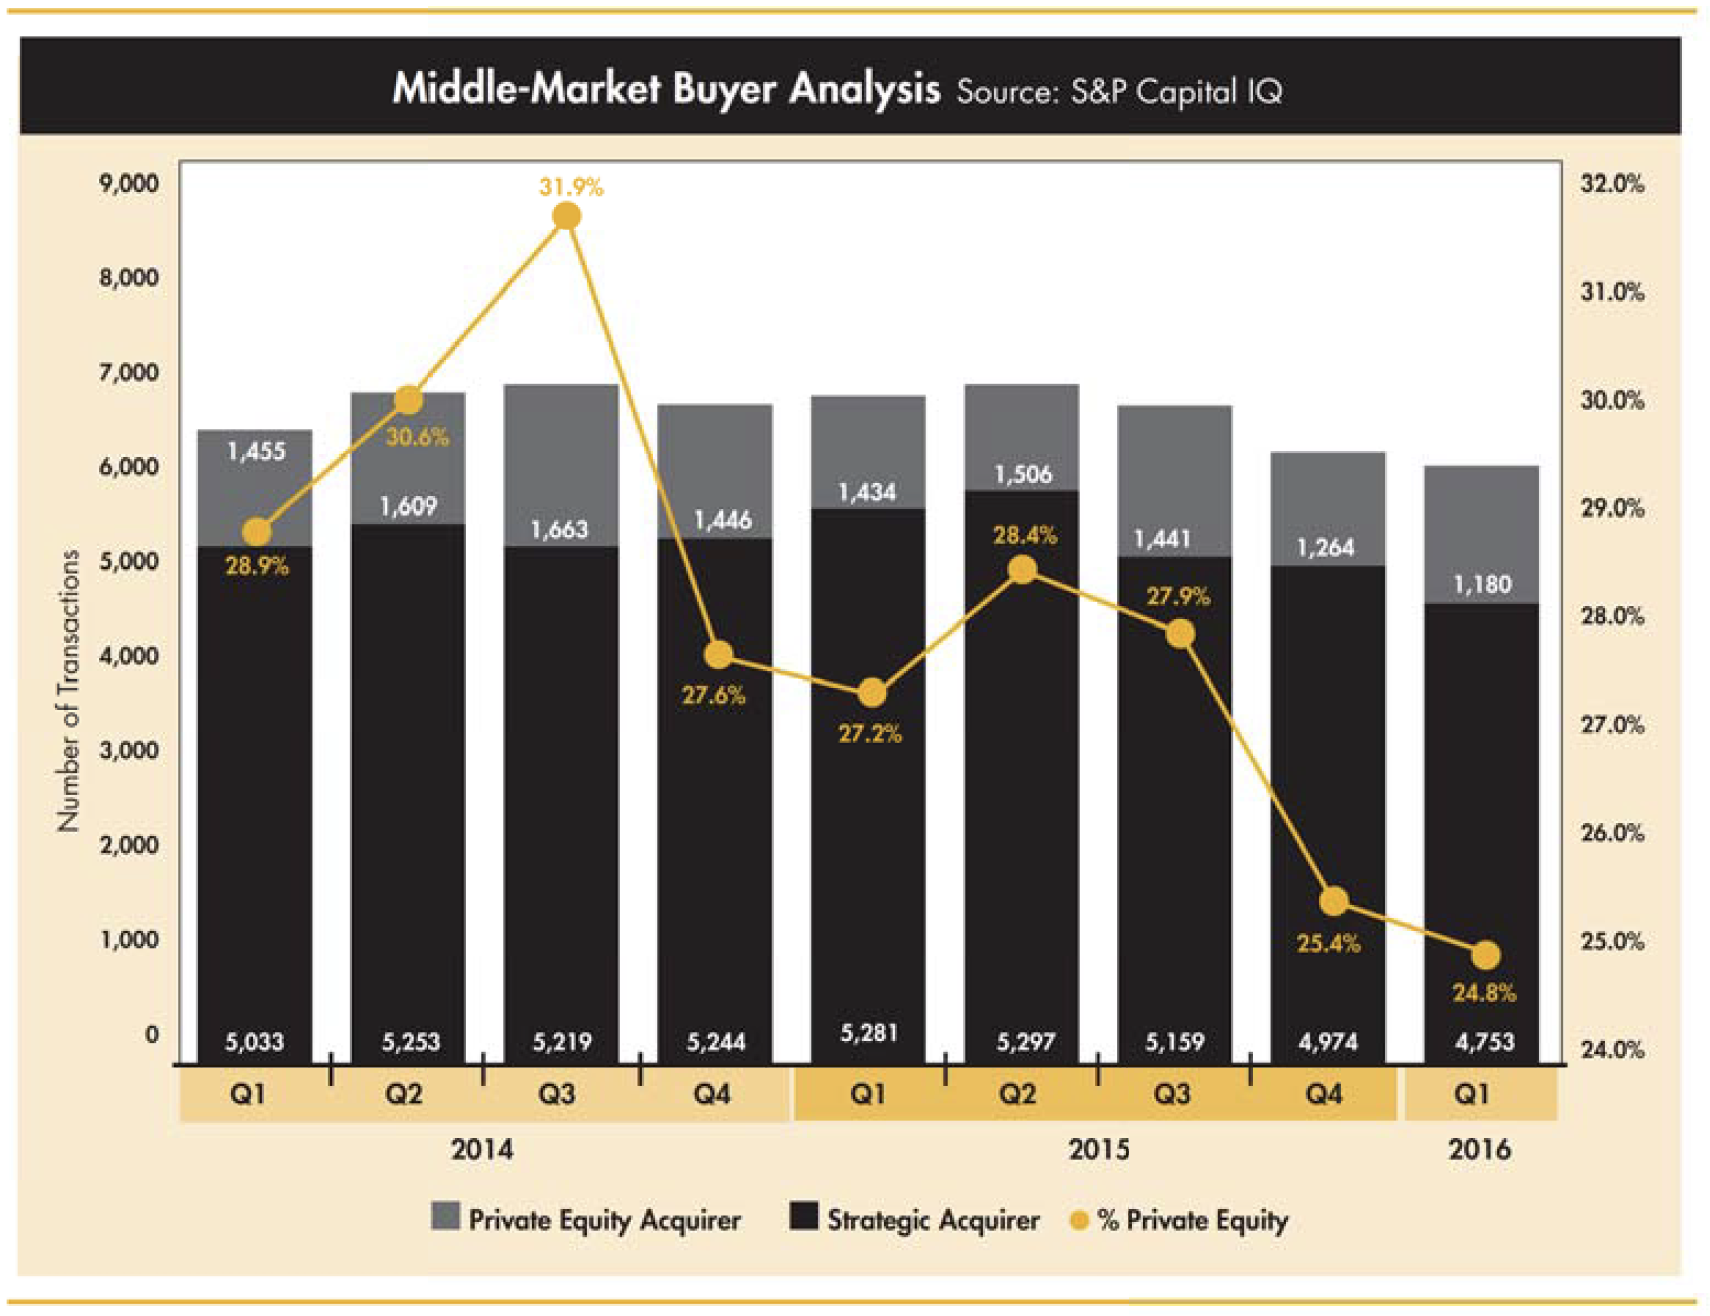
Tightening credit for private equity buyers is also evident in the decline of private equity-backed transactions as a percentage of total M&A activity. S&P Capital IQ indicates private equity accounted for only 24.8% of the buyers in Q1 2016, the lowest level in nine quarters. Without ample leverage, private equity firms are having difficulty matching current valuation levels, a signal of expected future normalization in valuation multiples.
At Wipfli Corporate Finance, we continue to see a big appetite for above-average companies from strategic and private equity buyers. Banks remain eager to lend money in support of companies with experienced leadership and the demonstrated ability to grow revenues and profits.
For companies that may be currently experiencing operational challenges, we strongly encourage working with Wipfli LLP and Wipfli Corporate Finance Advisors to examine transition options at least two years prior to an exit event.
Our team of experienced advisors can review your company and highlight issues that will likely be focused on during the due diligence phase of the transaction. Understanding and, more important, mitigating your company's transactional risk areas will allow you to enhance the probability of a successful transaction.
Our skilled WCF team provides extensive buyer relationships as well as an understanding of what various buyer groups value and how to negotiate through obstacles that arise.
Footnote:
Middle-Market Definitions: GF Data ($10 million-$250 million), Pitchbook ($10 million-$1 billion), S&P Capital IQ ($10 million-$250 million) Thomas Reuters LPC ($10 million-$500 million)
The content of this material should not be construed as a recommendation, offer to sell or solicitation of an offer to buy a particular security or investment strategy. The content of this material was obtained from sources believed to be reliable, but neither Wipfli Corporate Finance Advisors, LLC nor RKCA, Inc., warrants the accuracy or completeness of any information contained herein and provides no assurance that this information is, in fact, accurate. The information and data contained herein is for informational purposes only and is subject to change without notice. This material should not be considered, construed or followed as investment, tax, accounting or legal ad vice. Any opinions expressed in this material are those of the authors and do not necessarily reflect those of other employees of Wipfli Corporate Finance Advisors, LLC or RKCA, Inc. Investing in the financial markets involves the risk of loss. Past performance is not indicative of future results.


Looking to be more acquisitive?
Having an acquisition plan is critical. Start yours now.
Get the checklist now
Categories
Read all Market Updates and Insights
A quarterly, insightful look at middle-market merger and acquisition activity.
Thought-provoking articles on value, growth, and strategy, merger and acquisition news, research and analysis from WCF consultants.


