
A Step Toward Normalcy?
Please be aware: More recent data has been published since the time of this post. To see current market trends, check out the most recent issues of Market Updates.
If 2015 was a record year, perhaps 2016 was the year we began to see a return to normalcy in the M&A market as deal activity receded. The beginning of a retrenchment may be evidenced by emerging trends including a flight to quality, reemergence of platform value, and a greater reliance on equity capitol as a funding source for M&A. Private equity transaction volumes involving deals between $10 million and $250 million fell by 23.5% and 11.1% on a quarterover- quarter and year-over-year basis, respectively, according to GF Data©.
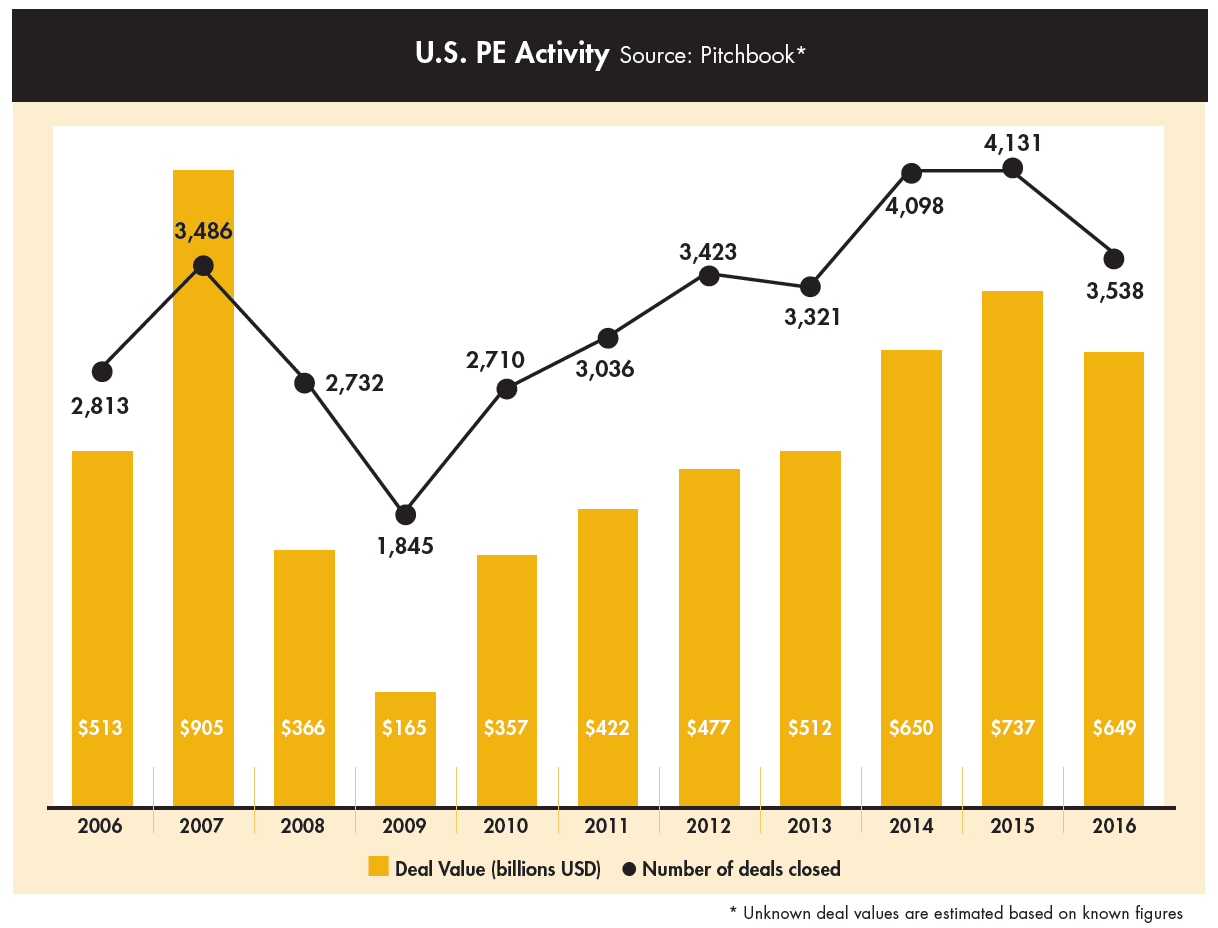
Coming off two of the best years in the last decode in terms of deal activity, 2016 deal activity receded according to Pitchbook's analysis of private equity deal flow. In terms of number of deals closed, the 3,53 8 deals closed during 20 16 represent a 14% year-over-year decline and ore similar to deal numbers last seen during 2012 and 2013. In terms of aggregate deal value, 2016 was off nearly 12% from 2015's peak figures.
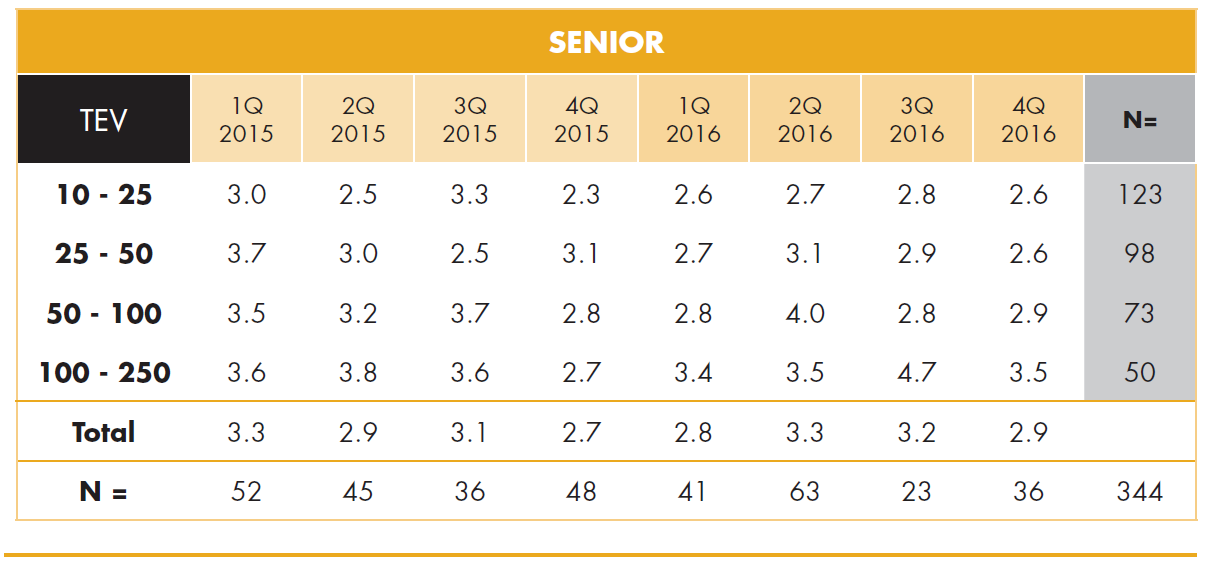
However, not all deal-related metrics retreated. According to GF Data, middle market deal valuations by their PE subscriber base achieved a peak during 2016, with an average TEV /EBITDA multiple paid of 6.9x as compared to 2014 and 2015 when the average multiple was 6.7x. In addition, middle-market companies are reporting the highest economic confidence levels in five years, according to the National Institute for the Middle Market, and most businesses remain willing to invest.
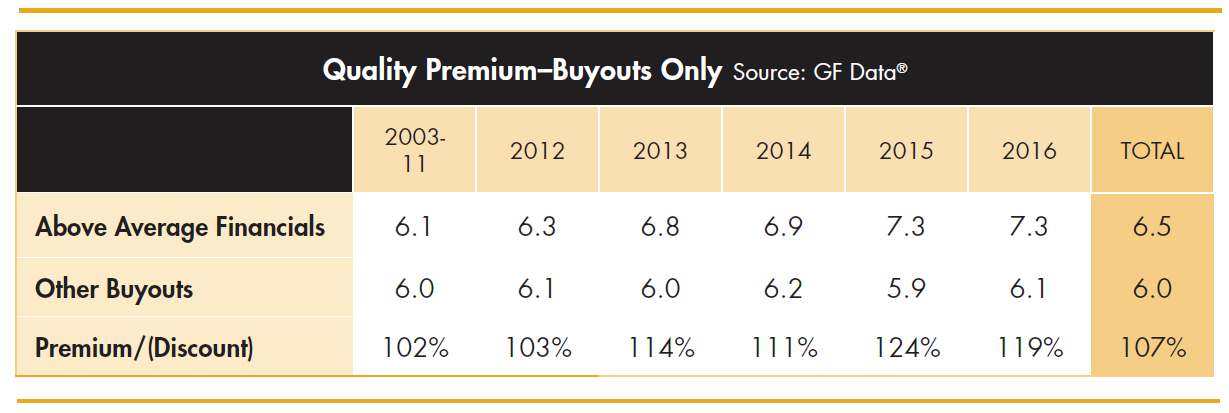
In today's challenging M&A environment, many corporations have chosen to compete with PE firms, resulting in rising multiples and squeezing out any margin for error on the part of private equity buyers. As a result, buyers are placing a premium on quality companies. According to GF Data, companies with above-average financials received a quality premium of 19%, down from 2015's premium of 24% but well ahead of the historic level of 7%. GF Data defined above average as companies with EBITDA margin and revenue growth rates above 1 0% or one of the metrics above 1 2% and the other at least 8%.
Platform Versus Add-On Valuations
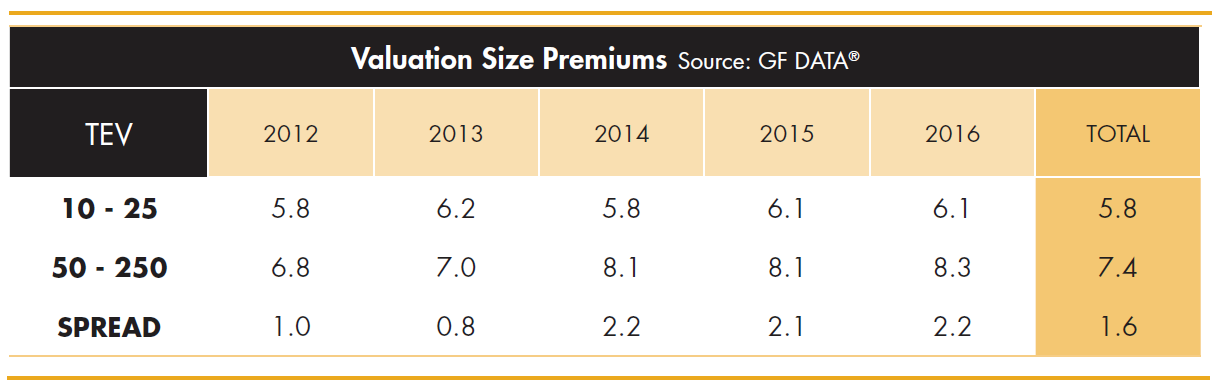
Another trend that reasserted itself during 2016 was the payment of a premium to acquire platform companies over addon acquisitions. According to GF Data's analysis of 2015 and 2016, transactions of $10 million to $50 million registered 0.7x higher valuation for platform acquisitions.
In addition, the valuation spread between larger ($50 million to $250 million) and smaller ($1 0 million to $50 million] transactions increased slightly between 2015 and 2016, from 2.1x to 2.2x trailing EBITDA, and has returned to levels seen during 2014. The data suggests buyers may continue to be willing to pay up for larger companies, while smaller company multiples have remained stable.
Credit Conditions
The decline in transaction activity observed during 2016 is caused, in port, by lenders scrutinizing deals more closely. According to Thomson Reuters' Leveraged Loon Monthly, new origination of middle-market leverage loons for deals below $ 100 million stabilized during 2016 at $33.6 billion, down 2% from $33.7 billion during 2015. The peak of new originations over the last 10 years occurred during 2013 when $43.2 billion of new middle-market loans were originated. The total values of leveraged loan originations during 2015 and 2016 were at their lowest levels since 2009.
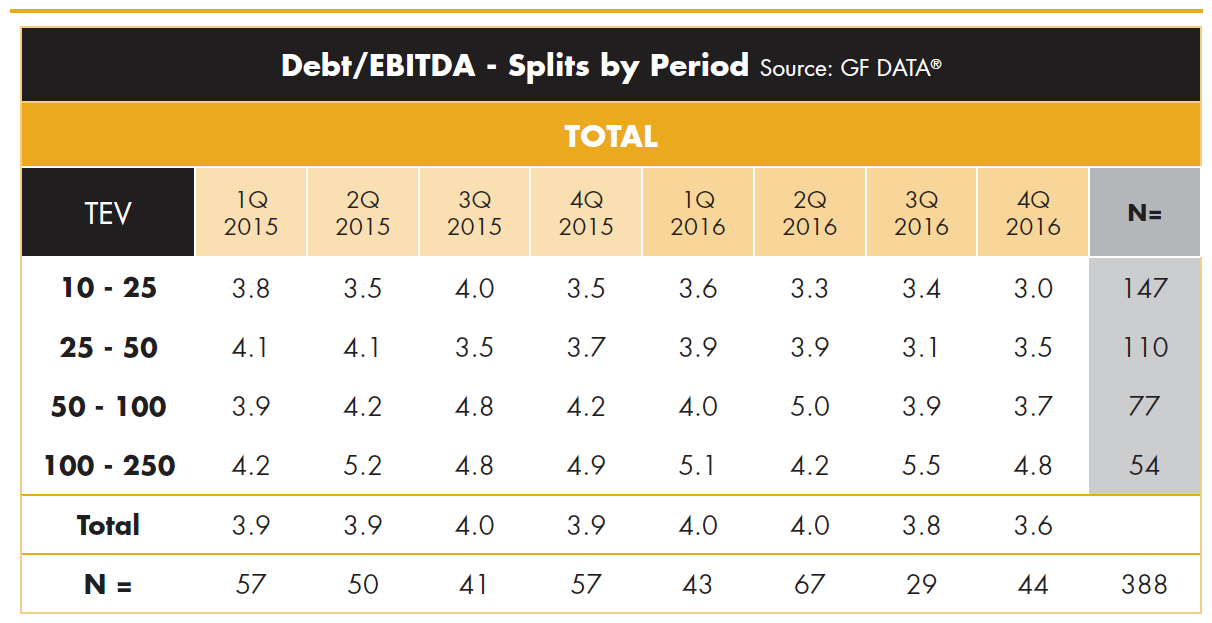
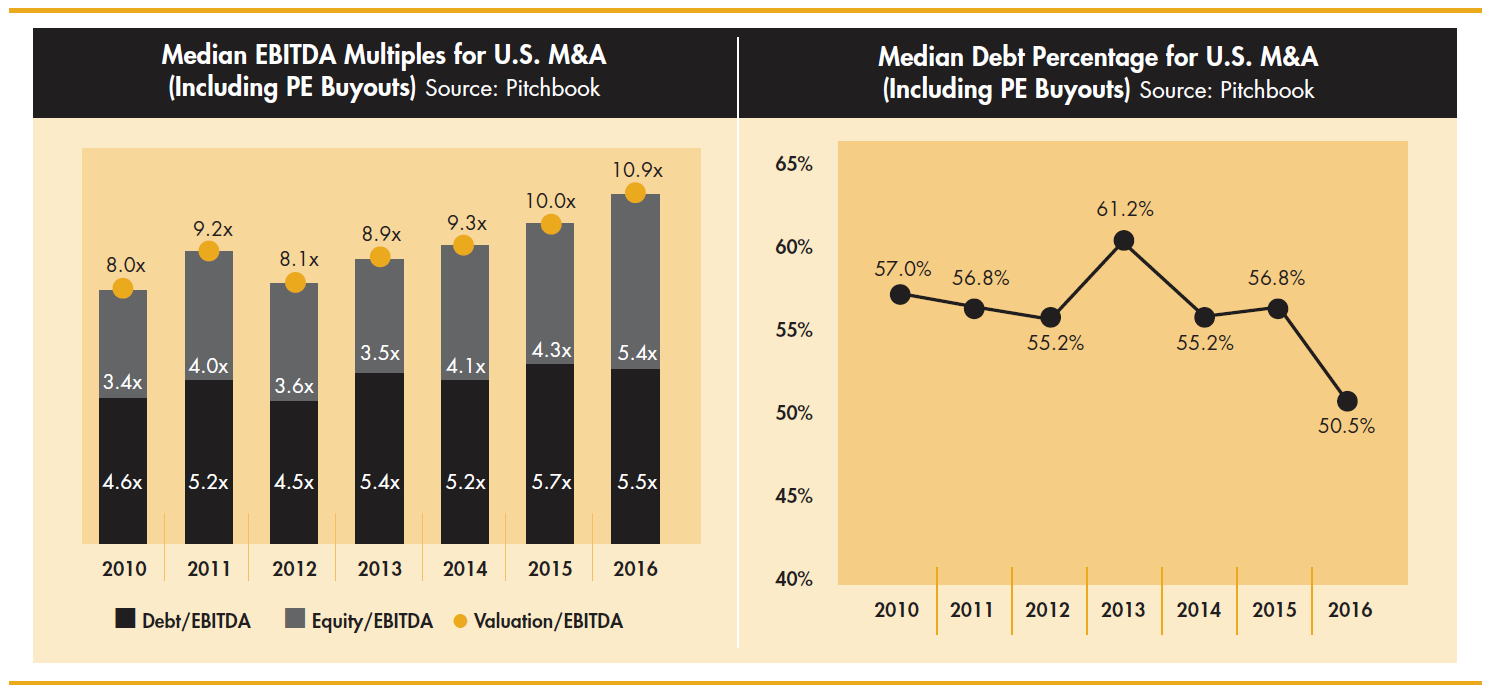
Though off their peak, other indications of stability throughout the credit markets can be observed. GF data shows debt multiples decreased only slightly between 2015 and 2016, with overage total debt to EBITDA ratios decreasing from 3.8x to 3.6x. For deal values between $1 0 million and $25 million, the change was more pronounced as total debt to EBITDA multiples declined from 3.4x to 3.0x.
Credit Impact on Valuations
Average equity contributions for middlemarket transactions rose from 43.2% during 2015 to 49.5% during 2016, according to Pitchbook. Increased equity requirements to complete buyouts reduce returns for private equity funds without a change in valuations. leverage, measured by debt to EBITDA, declined by 0.2x between 2015 and 2016.
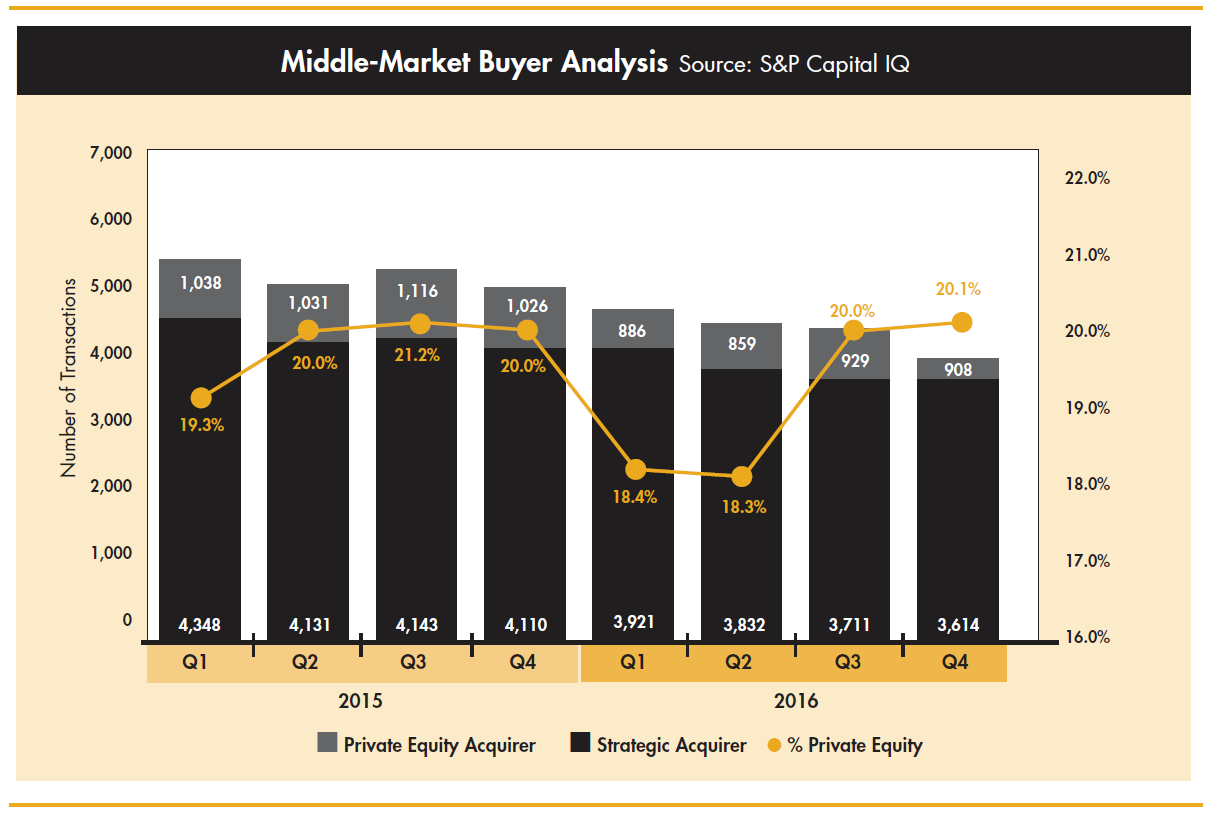
A stable credit environment for private equity buyers is also evident in the observed stability in the number of private equity-backed transactions as a percentage of total M&A activity. S&P Capital IQ indicates private equity accounted for 20.1% of the buyers in the fourth quarter of 2016, largely in line with the percentages observed over the previous eight quarters. Were the credit environment to deteriorate, private equity firms might have difficulty matching current valuation levels, signaling potentially lower future multiples paid.
At Wipfli Corporate Finance, we continue to see stability in the M&A and credit markets along with strong demand for above-overage companies. Bonks remain eager to lend money in support of companies that demonstrate the ability to grow revenues and profits and manage their business effectively; however, we are likely entering a period of rising interest rates, according to indications from the Federal Reserve.
The equity markets continue to rally, and consumer and business sentiment is reported to be at levels not seen since before the Great Recession. We ore in the eighth year of an upward trending bull market, and right now is a great time to consider your goals and options related to your company's succession plan. While this may or may not include a sale to a third party, our team of experienced advisors can help you understand and assess all of your succession options. Having a well thought-out succession plan in place will allow you to enhance the probability of a successful transition and mitigate the risk of having to wait out the next recession or, worse, having to exit your company during the next recession.
Footnote: Middle-Market Definitions: GF Dot o ($10 million-$250 million), Pitchbook ($10 million-$1 billion), S&P Capital IQ (less then $250 million), Thomson Reuters LPC (Less than $100 million)
The content of this material should not be construed as a recommendation, offer to sell or solicitation of an offer to buy a particular security or investment strategy. The content of this material was obtained from sources believed to be reliable, but neither Wipfli Corporate Finance Advisors, LLC nor RKCA, Inc., warrants the accuracy or completeness of any information contained herein and provides no assurance that this information is, in fact, accurate. The information and data contained herein is for informational purposes only and is subject to change without notice. This material should not be considered, construed or followed as investment, tax, accounting or legal ad vice. Any opinions expressed in this material are those of the authors and do not necessarily reflect those of other employees of Wipfli Corporate Finance Advisors, LLC or RKCA, Inc. Investing in the financial markets involves the risk of loss. Past performance is not indicative of future results.

Looking to be more acquisitive?
Having an acquisition plan is critical. Start yours now.
Get the checklist now
Categories
Read all Market Updates and Insights
A quarterly, insightful look at middle-market merger and acquisition activity.
Thought-provoking articles on value, growth, and strategy, merger and acquisition news, research and analysis from WCF consultants.


